
The OKRs app lets you set and track Objectives and Key Results across your organisation, so everyone can see what you are aiming for and how progress is measured. It is available on Pro plans.
This article covers turning the app on, creating your first OKRs, tracking key results that climb or count down, and how OKRs relate to your circles. For custom fields, see Custom fields.
A workspace admin turns the app on in Workspace settings → Applications. It is listed as Objectives & Key Results (OKRs).

Nestr supports key results that count down as well as key results that climb. If your goal is to take a number from 19 to 0, or to keep a number above a line you have set, you can express both. The control is the range on the key result.
Every key result has a Progress field. Out of the box it is a percentage slider labelled Progress (%), which is why it can look like 0 to 100 is the only thing Nestr tracks. Give the field a range and it counts in your own unit instead.
The field label changes from Progress (%) to Progress (between 25 and 15 for example), and the slider counts in your unit rather than percent.
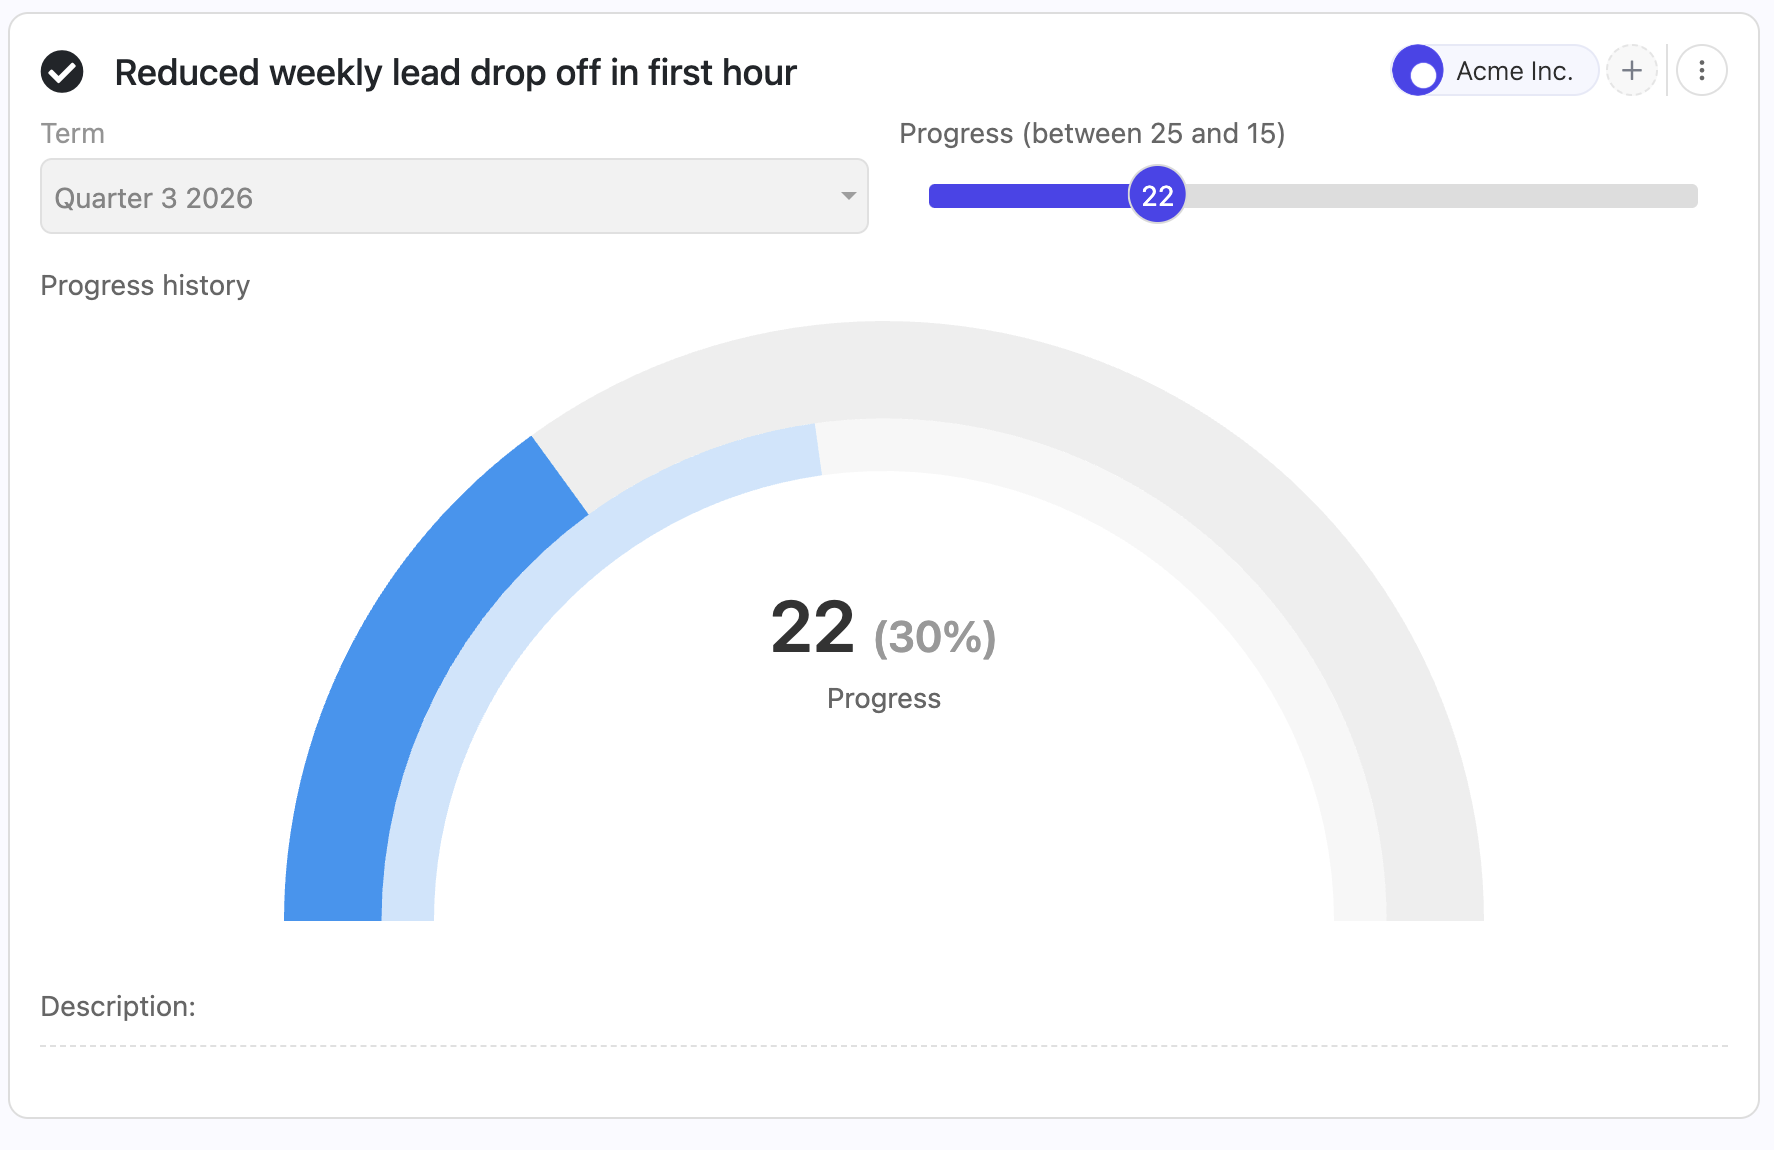
Set both bounds or neither. Clearing both removes the range and returns the field to a percentage slider. The start and the end cannot be the same number.
Take "Reduced weekly lead drop off in first hour: 25 to 15".
Because the start is higher than the end, Nestr treats the key result as descending. The slider still fills from left to right as you improve, but the number on the handle counts down. Each time you lower the value, progress goes up: 25 left is 0%, 22 left is 30% and 15 left is 100%.
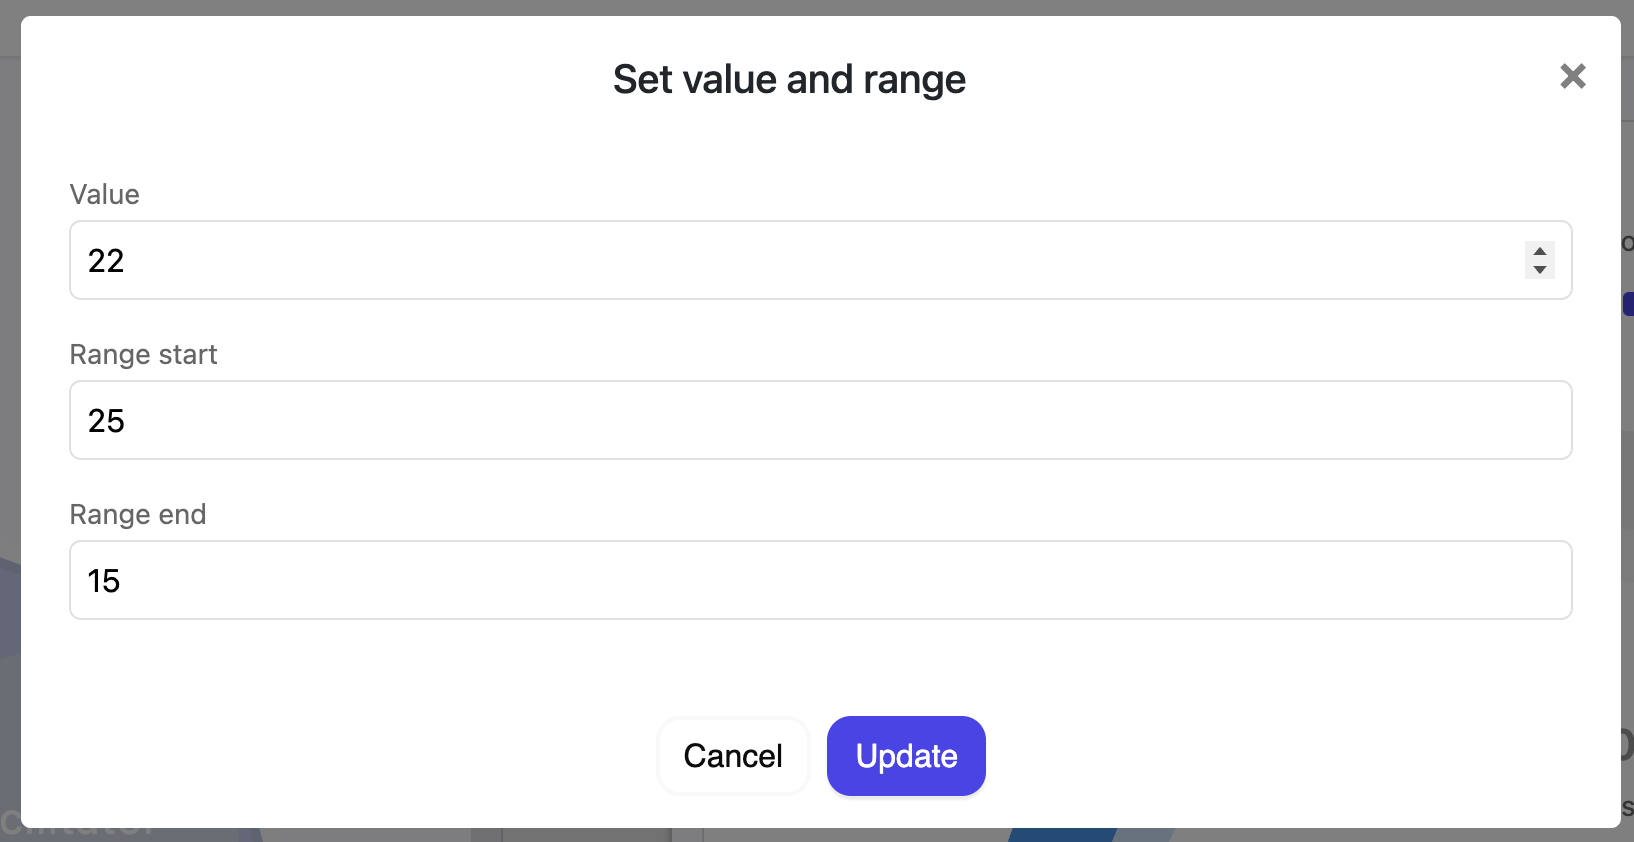
You are not locked to the bounds. If the number goes the wrong way and you find 22 outdated repositories, type 22 into Value. The dialog accepts values outside the range and the slider widens to show it.
There is no separate "maintain" key result type, which is where most people stop looking. Use the same range and point it at the outcome you want.
The rule that covers every case: Range start is the value that counts as not achieved, and Range end is the value that counts as fully achieved. Climbing, counting down, and holding a line are all the same mechanism.
For "engineer tooling satisfaction remains positive", measured on a scale from -5 to +5, set the start to 0, the floor you are defending, and the end to 5, the top of the scale. A reading of 3.8 shows 76%. If sentiment slides back to neutral the key result drops to 0%, which is the signal you wanted.
For "median review turnaround stays under 24 hours", where 4 hours is as good as it realistically gets, set the start to 24, the ceiling you must not cross, and the end to 4. A median of 9 hours shows 75%. Cross back over 24 hours and the key result reads 0%.
Range start is 0% and Range end is 100%, whichever direction they run in. Progress is how far the current value has travelled from the start toward the end. With no range set, the Progress field is a straight percentage.
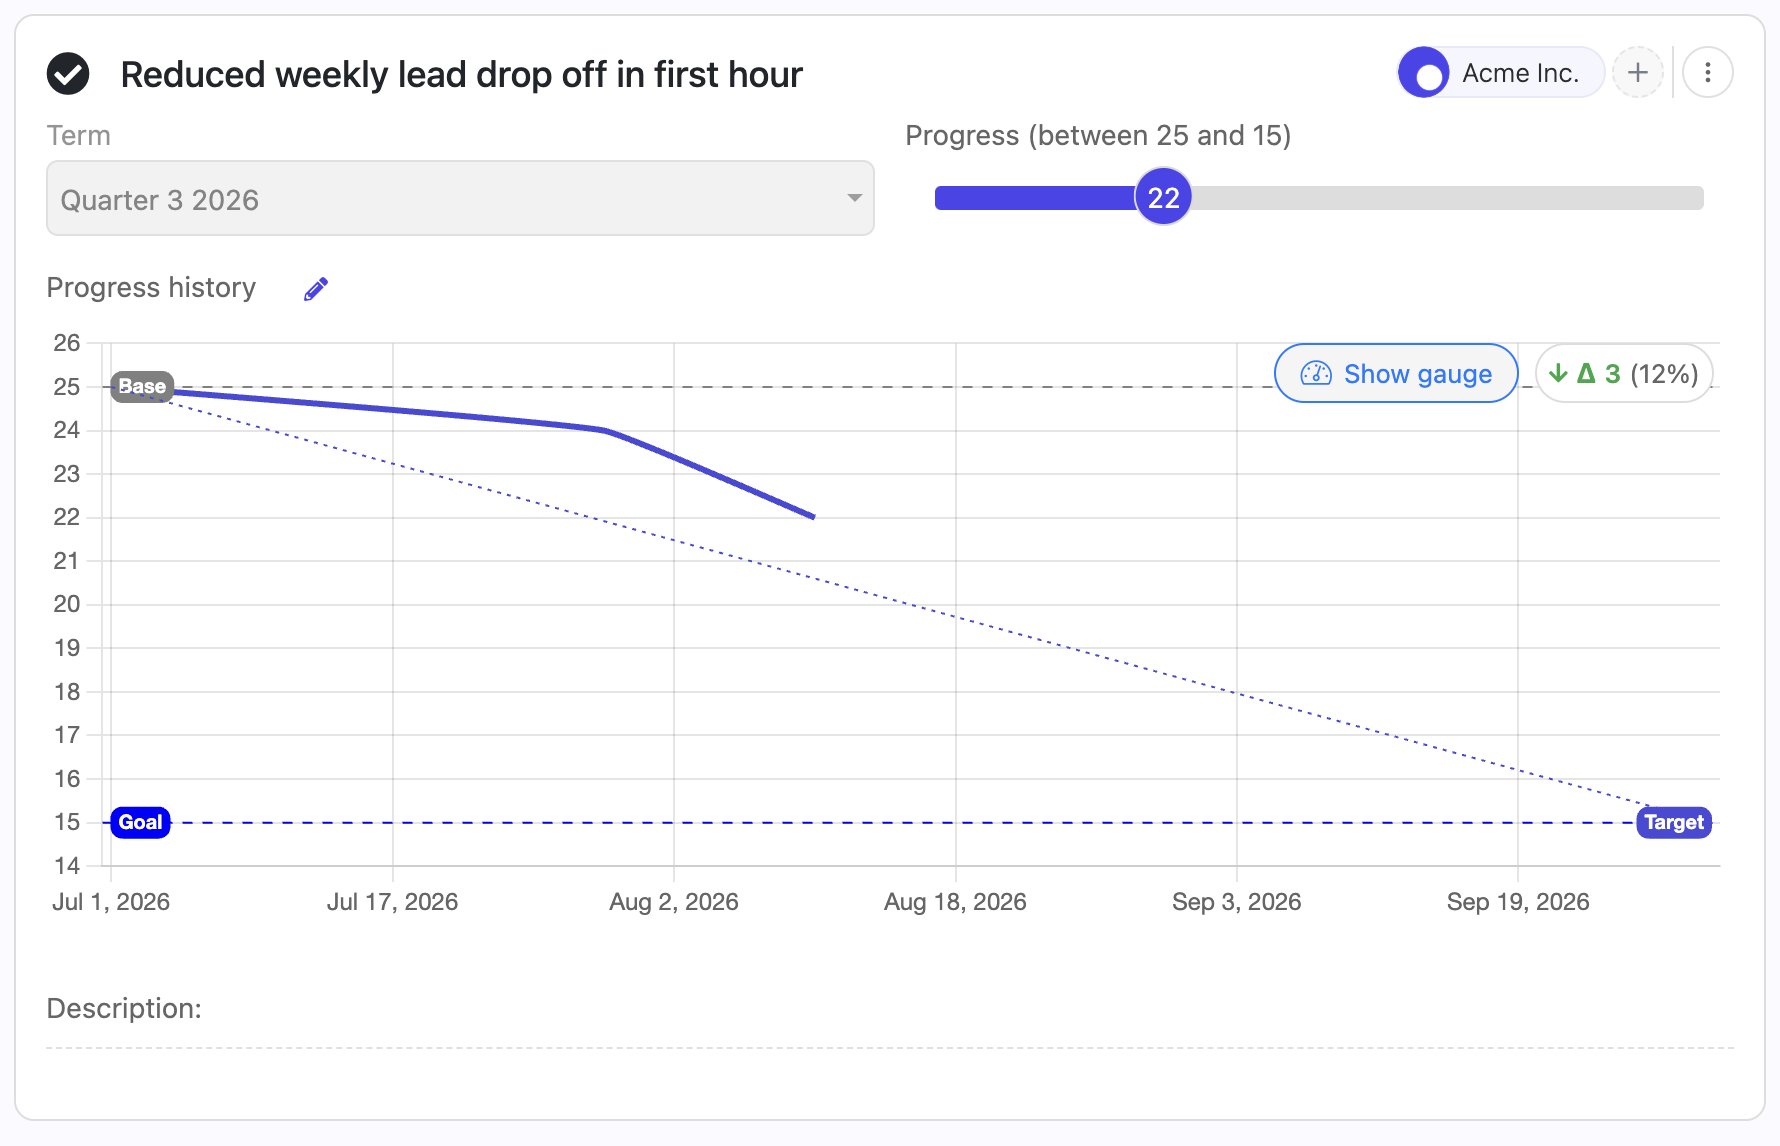
The Progress history field on a key result has two views, and the toggle sits above the chart. Show gauge is where a key result with a term opens: the outer ring is progress toward your target and turns green when the target is reached, the inner ring is how much of the term has elapsed, and the centre shows the current value with its percentage in brackets. Show trend switches to a line chart of the value across the term. Both views read the same history, so switching between them changes nothing about your data.
OKRs sit in your circle structure:
Objectives can be nested. Create a contributing Objective underneath a parent Objective, then open it, choose Re-assign Objective owner, and pick the circle or role that will carry it. The child stays under its parent Objective, so the link from the parent goal to the contributing goal stays explicit, and it also appears on the owning circle's own boards. That is how a workspace or circle objective cascades down to the teams contributing to it.
What does not cascade is progress. Only Key Results move an Objective's percentage. A contributing Objective adds nothing to its parent's number, however far along it is. This is deliberate: it keeps each Objective measured by results defined against it, rather than by an average of averages.
One consequence worth knowing: an Objective whose children are all contributing Objectives, with no Key Results of its own, shows 0%. If you want a parent Objective to show progress, give it its own Key Results.


.png)


